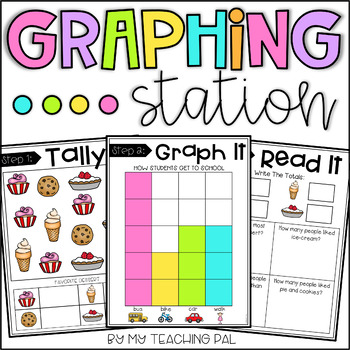
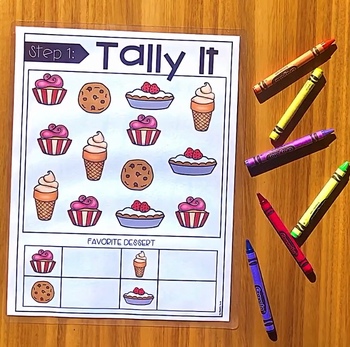
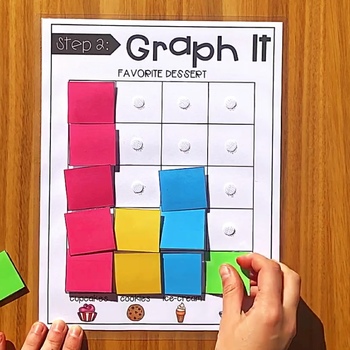
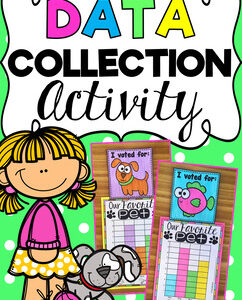
Students will love completing this data collection activity. It can help to provide them with fundamental practice in tallying data, graphing data and interpreting data. In Step 1 students count and tally items. In Step 2 they use the tally data they collected to formulate a graph and finally, in Step 3, students interpret the results.
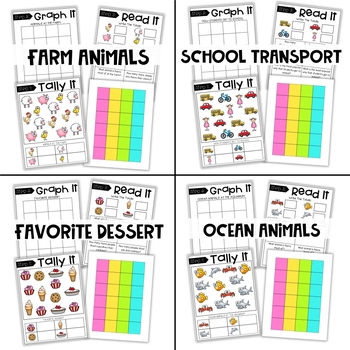
The following 4 themes are included:
♥ Favorite Dessert
♥ Animals at the Farm
♥ How Students Get to School
♥ Ocean Animals at the Aquarium
Each graph has four categories. The packet includes a USA Version as well as an Australian/UK version.
See the preview for more details!
Reviews
There are no reviews yet.